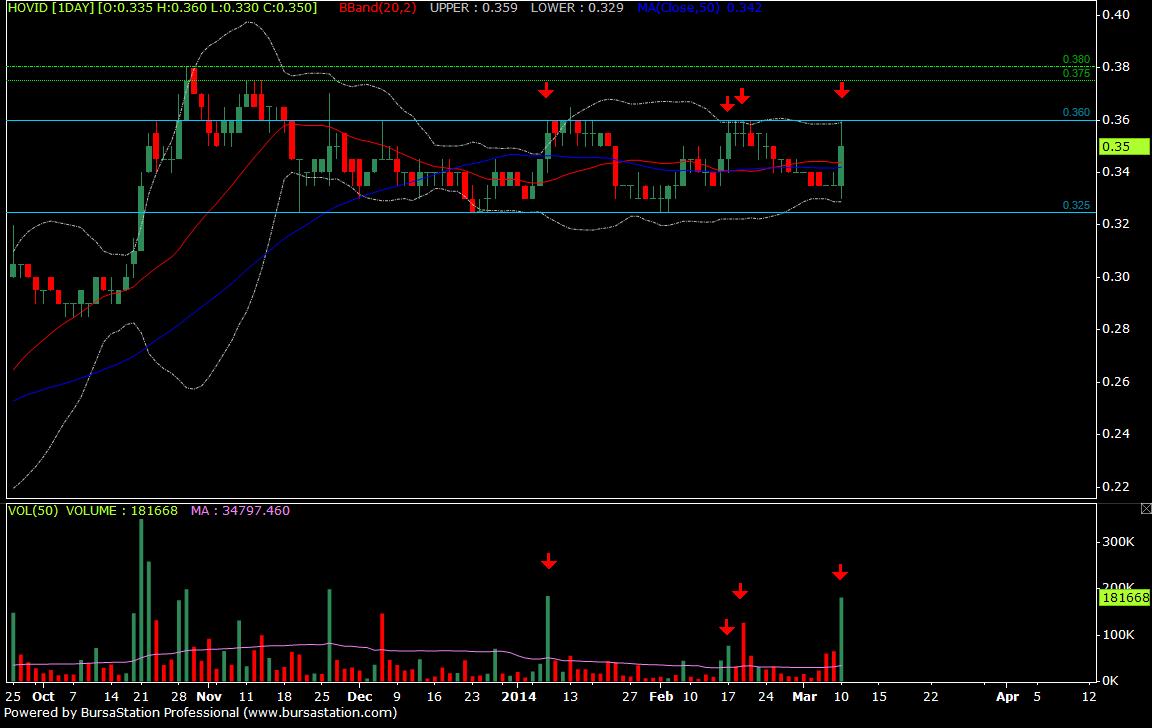
After 1st wave of uptrend, HOVID is going through a sideways trend with major support at 0.325 and a major resistance at 0.36.
Combining Volume and Support and Resistance, HOVID price and volume set up shows there are high demand (Shown in Red Arrow) pushing the price up but due to there are still supply in the market at resistance level 0.36, HOVID unable to penetrate through and resume uptrend. However, the amount of supply in HOVID is relatively lesser than demand, as we can see from the chart, when the price fall, no high volume before. This provide the signal of Demand is more than supply in HOVID.
Today with very high volume coming into HOVID again, testing 0.36 resistance. If the price should breakthrough this resistance, HOVID will resume in uptrend again.
But do take note of the next resistance at 0.375 and 0.38 which is the previous high. If these 2 resistance is broken, higher chances for HOVID to climb higher to all time high level at 0.415.
Please take note, entry point is when confirmation on resistance breakout with high volume, if no such confirmation signal, the risk will be higher.
